Scorecards & producer tiers
The Scorecards screen (sidebar → Scorecards) is the producer leaderboard: every scored producer ranked by composite score, with the contributing dimensions listed alongside. Each producer’s own score and dimension breakdown also appears on the Scores tab of their detail page (Managing producers).
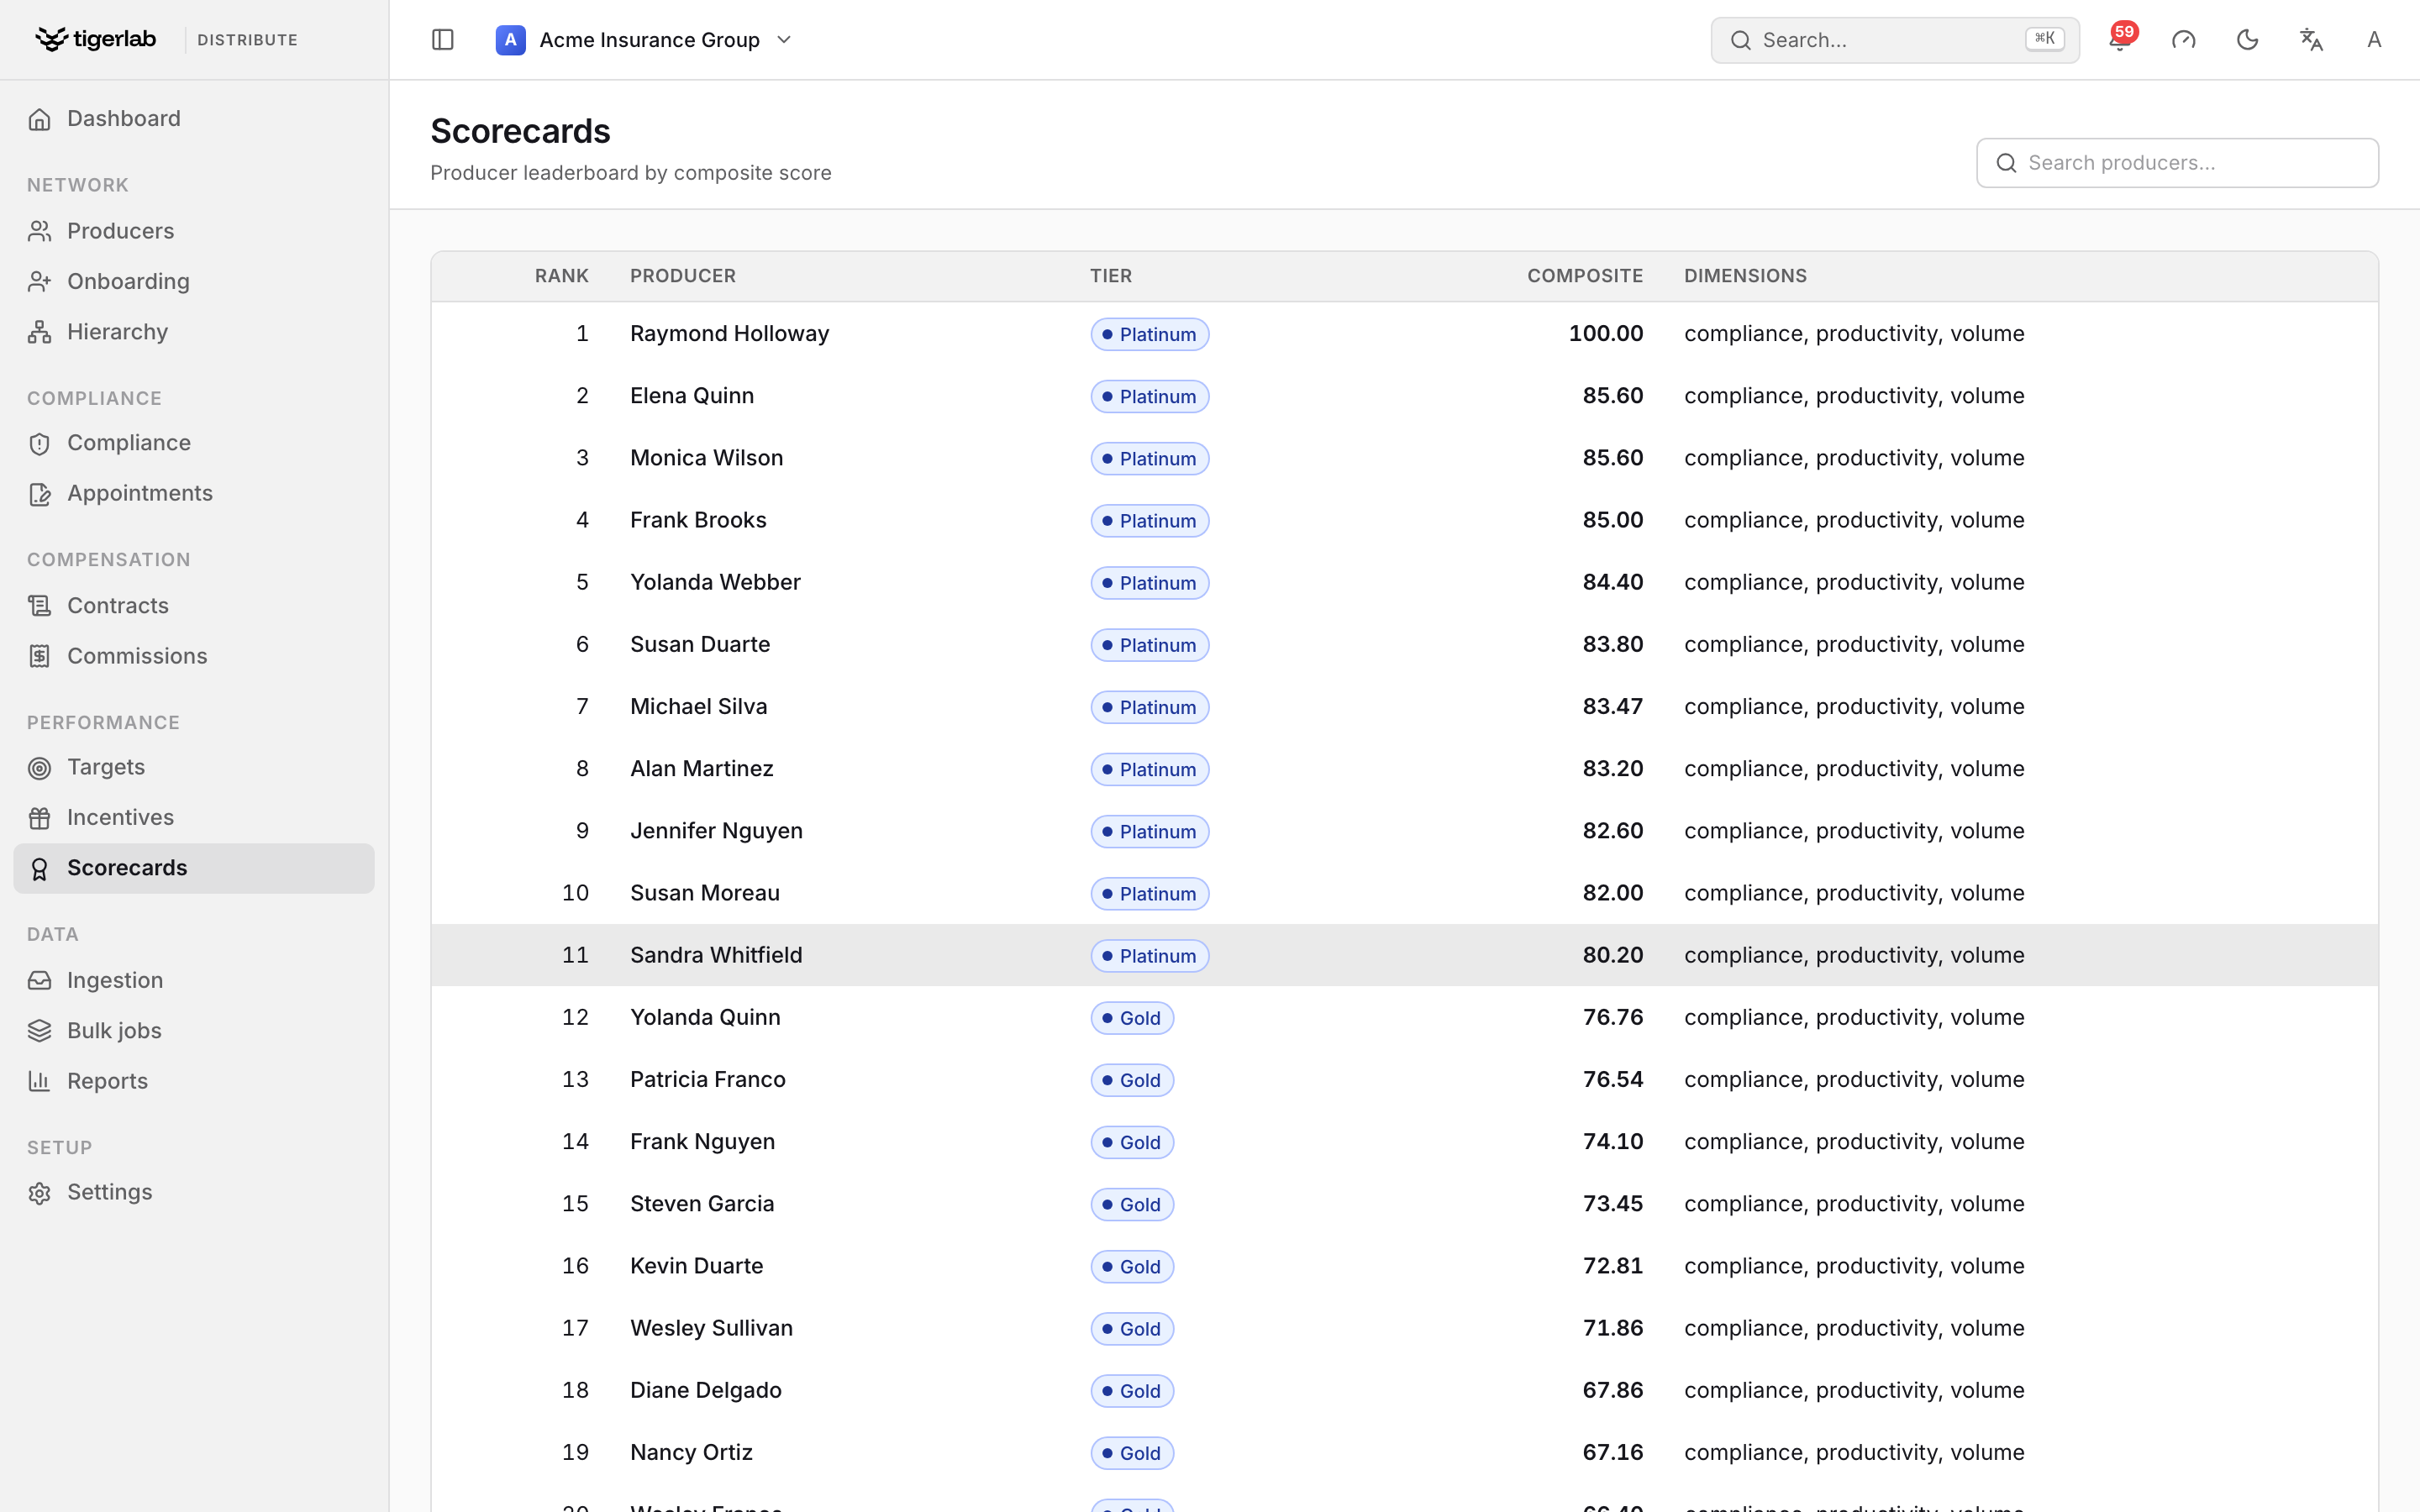
The Scorecards leaderboard: producers ranked by composite score, with their performance tier and the dimensions (compliance, productivity, volume) that feed the score.
How the score is computed
Scoring runs in the background on a period basis (monthly, quarterly or annual). For each producer the platform first builds a performance snapshot from ingested data and open compliance alerts: new-business premium, renewal premium, total premium, policy count, commission earned, and the number of open compliance alerts.
From the snapshot, three dimension scores are computed, each capped between 0 and 100:
Dimension |
Formula |
Default weight |
|---|---|---|
Volume |
total premium ÷ volume benchmark × 100 |
40 % |
Productivity |
policy count ÷ policy benchmark × 100 (policy count = distinct in-force policies, net of cancellations) |
30 % |
Compliance |
100 − 10 points per open compliance alert |
30 % |
The composite score is the weighted sum of the three dimensions.
The weights and benchmarks come from your tenant’s scoring configuration (defaults: volume benchmark 500,000; policy benchmark 100). Exactly one configuration is active per tenant at a time; it is maintained by administrators, and changing it changes how everyone is scored at the next computation.
Note
Open compliance alerts directly depress a producer’s score — ten points per open alert. Resolving alerts (Compliance monitoring) is the fastest way for a producer’s compliance dimension to recover.
Producer tiers
Managers define tier bands under Performance → Design → Tier bands — named score ranges such as Platinum 90–100, Gold 75–89 — optionally with a commission-rate override per tier. When a producer is scored, they are placed into the band their composite score falls in, their current tier assignment (with the score at assignment time) is updated, and the tier appears on their record throughout the application. Tier history is kept.
When a tier carries a commission-rate override, it becomes the producer’s effective commission rate while they hold the tier, replacing their default rate (shown on the producer’s Overview with a “tier override” note).
Manual overrides
Scoring is not always the whole story. On a producer’s detail page, managers can click Change… next to the tier and either pick a tier directly or select Automatic — from performance score. A manually picked tier is pinned: scoring runs leave it in place (the record is labelled manual override) until someone switches the producer back to automatic, at which point they are immediately re-tiered from their latest score.
Reading the leaderboard
The Scorecards table shows Rank, Producer, their current Tier, Composite score and the scored Dimensions, and can be narrowed with the search box in the header. Scores are read-only — they change when the scoring job next runs, not by manual edit.
Click a producer’s row to open their score detail page — its own URL, with a breadcrumb back to Scorecards and the producer name linking through to their Hub. The page explains the composite through a per-dimension breakdown (each dimension shown with a bar), and a Tier & pay section shows the tier band the score falls in together with the commission-rate override that tier carries — the whole score → tier → commission link on one screen. If the board is empty (“No scores computed yet.”), scoring has not yet run for the period or no production data has been ingested.